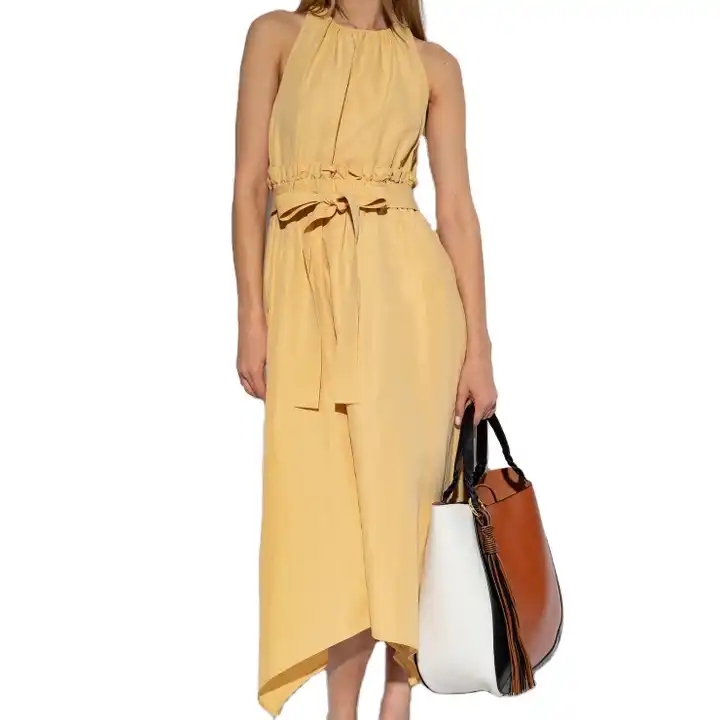
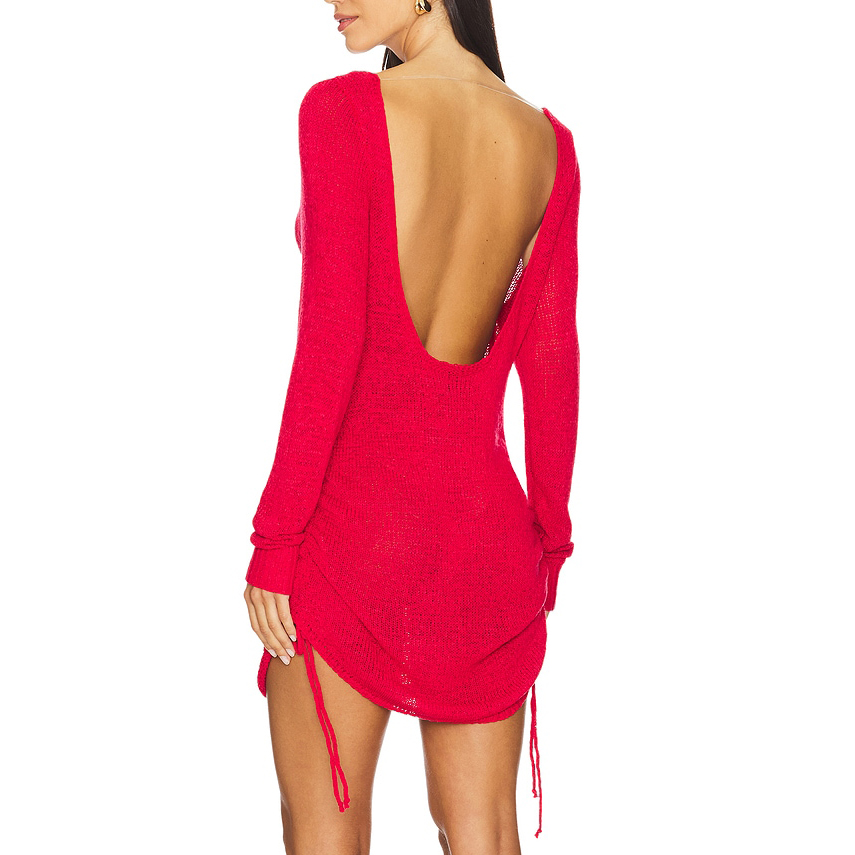
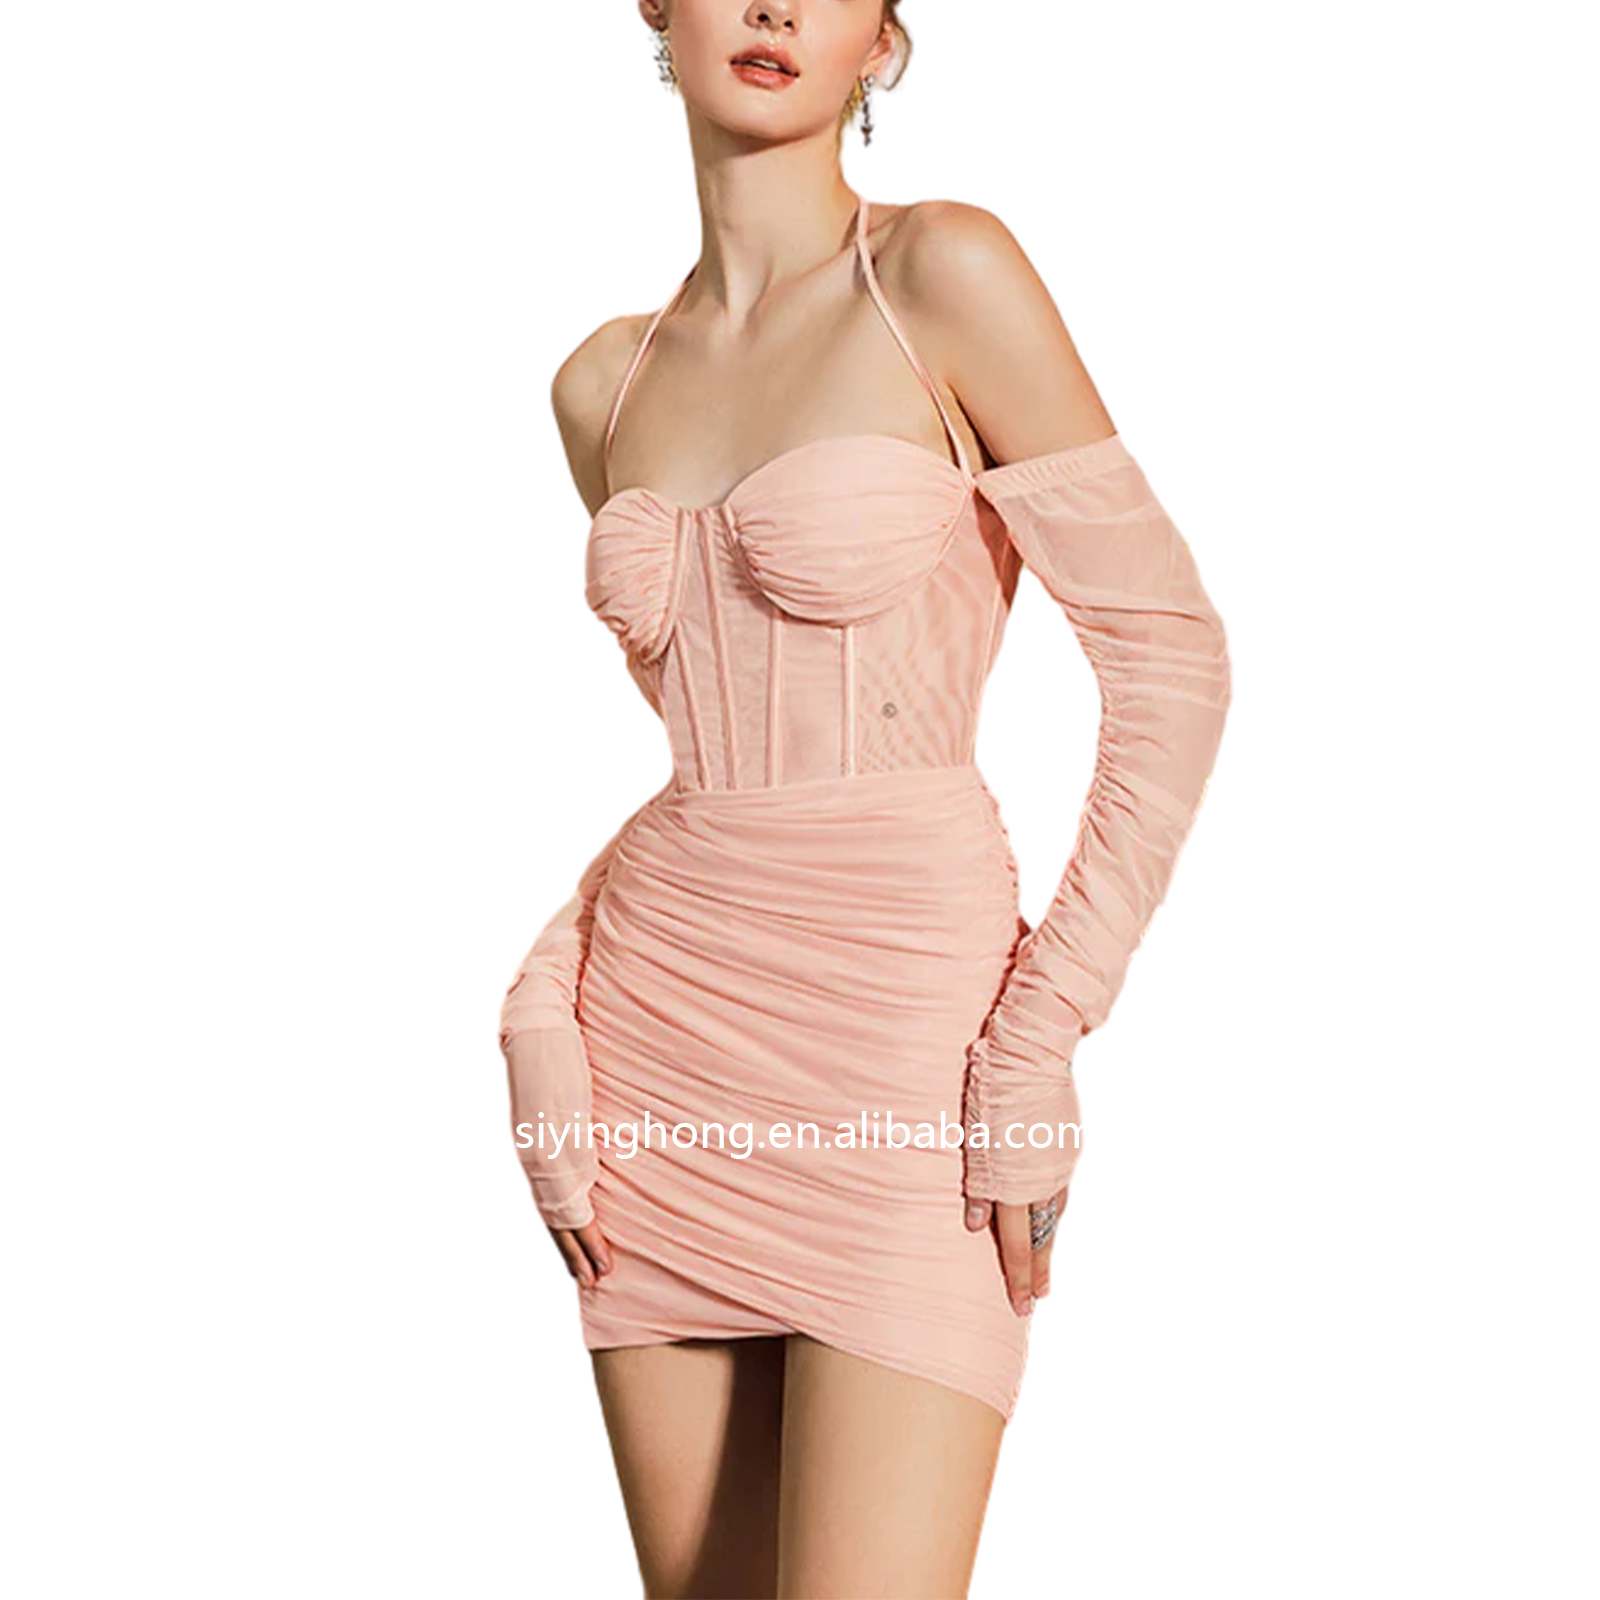
As a custom halter dress manufacturer, I design and produce elegant, comfortable gowns tailored for wholesale campaigns and brand collaborations. I work directly with retailers and Manufacturers seeking reliable partner for consistent quality and timely delivery. You’ll find our process simple: choose the fabric, silhouette, and trims; I’ll translate your specs into samples and then scale for production. We offer competitive pricing for Wholesale orders and low minimums for many styles, with options for private labeling and size ranges to fit your market. My team uses durable stitching, seam finishes, and color-fast dyes to ensure every piece looks amazing wear after wear. Lead times are kept predictable, and I provide you with fabric swatches, production photos, and QA checks at every step. From design mockups to finished shipments, I’m here to help manufacturers and retailers grow together. Let me align our capabilities with your season’s demands and boost your catalog.
Global buyers need more than a dress; they need a reliable partner that turns concepts into flawless garments. A trusted custom halter dress manufacturer delivers unmatched quality through an integrated end-to-end solution—from fabric sourcing and prototyping to streamlined production and rigorous QC. The result is consistent fit, drape, and color fidelity across styles. From design collaboration to sampling, the process minimizes risk for new collections. Detailed tech packs, accurate size grading, and optional 3D previews help lock in details before cutting. We offer a broad fabric and trim selection, private labeling, packaging options, and sustainable practices that align with brand requirements. Lead times are transparent and scalable, with a dedicated team managing material procurement, production, QA, and on-time delivery. Global buyers gain a reliable, end-to-end path from concept to consumer, backed by consistent quality, clear communication, and proactive support for seasonal demand.
| Dimension | 2023 | 2024 | Notes |
|---|---|---|---|
| Production Capacity (units/day) | 420 | 460 | Factory floor capacity after line balancing |
| On-time Delivery Rate (%) | 92.5 | 95.1 | Percentage of orders shipped on or before promised date |
| Defect Rate (%) | 1.8 | 1.2 | Percentage of units rejected or reworked |
| Material Yield (%) | 96.2 | 97.8 | Raw material usage efficiency |
| Average Lead Time (days) | 8.5 | 7.2 | From order receipt to shipment |
| End-to-End Cycle Time (days) | 12.4 | 10.6 | Total time from order to delivery |
| Energy Consumption (kWh per unit) | 2.4 | 2.1 | Electric energy per unit produced |
| Water Usage (Liters per unit) | 1.9 | 1.7 | Water usage in dyeing and finishing |
| Carbon Emissions (kg CO2e per unit) | 0.62 | 0.54 | Scope 1+2 per garment |
| Supplier Quality Score (0-100) | 88 | 92 | Aggregate quality rating from primary material suppliers |
| Return Rate (%) | 1.1 | 0.9 | Returns within 30 days |
| Packaging Waste (kg per unit) | 0.15 | 0.12 | Packaging waste per unit |
| Automation Level (% of processes automated) | 28 | 36 | Share of processes automated |
| Customer Satisfaction Score (0-100) | 84 | 89 | Post-delivery customer survey score |