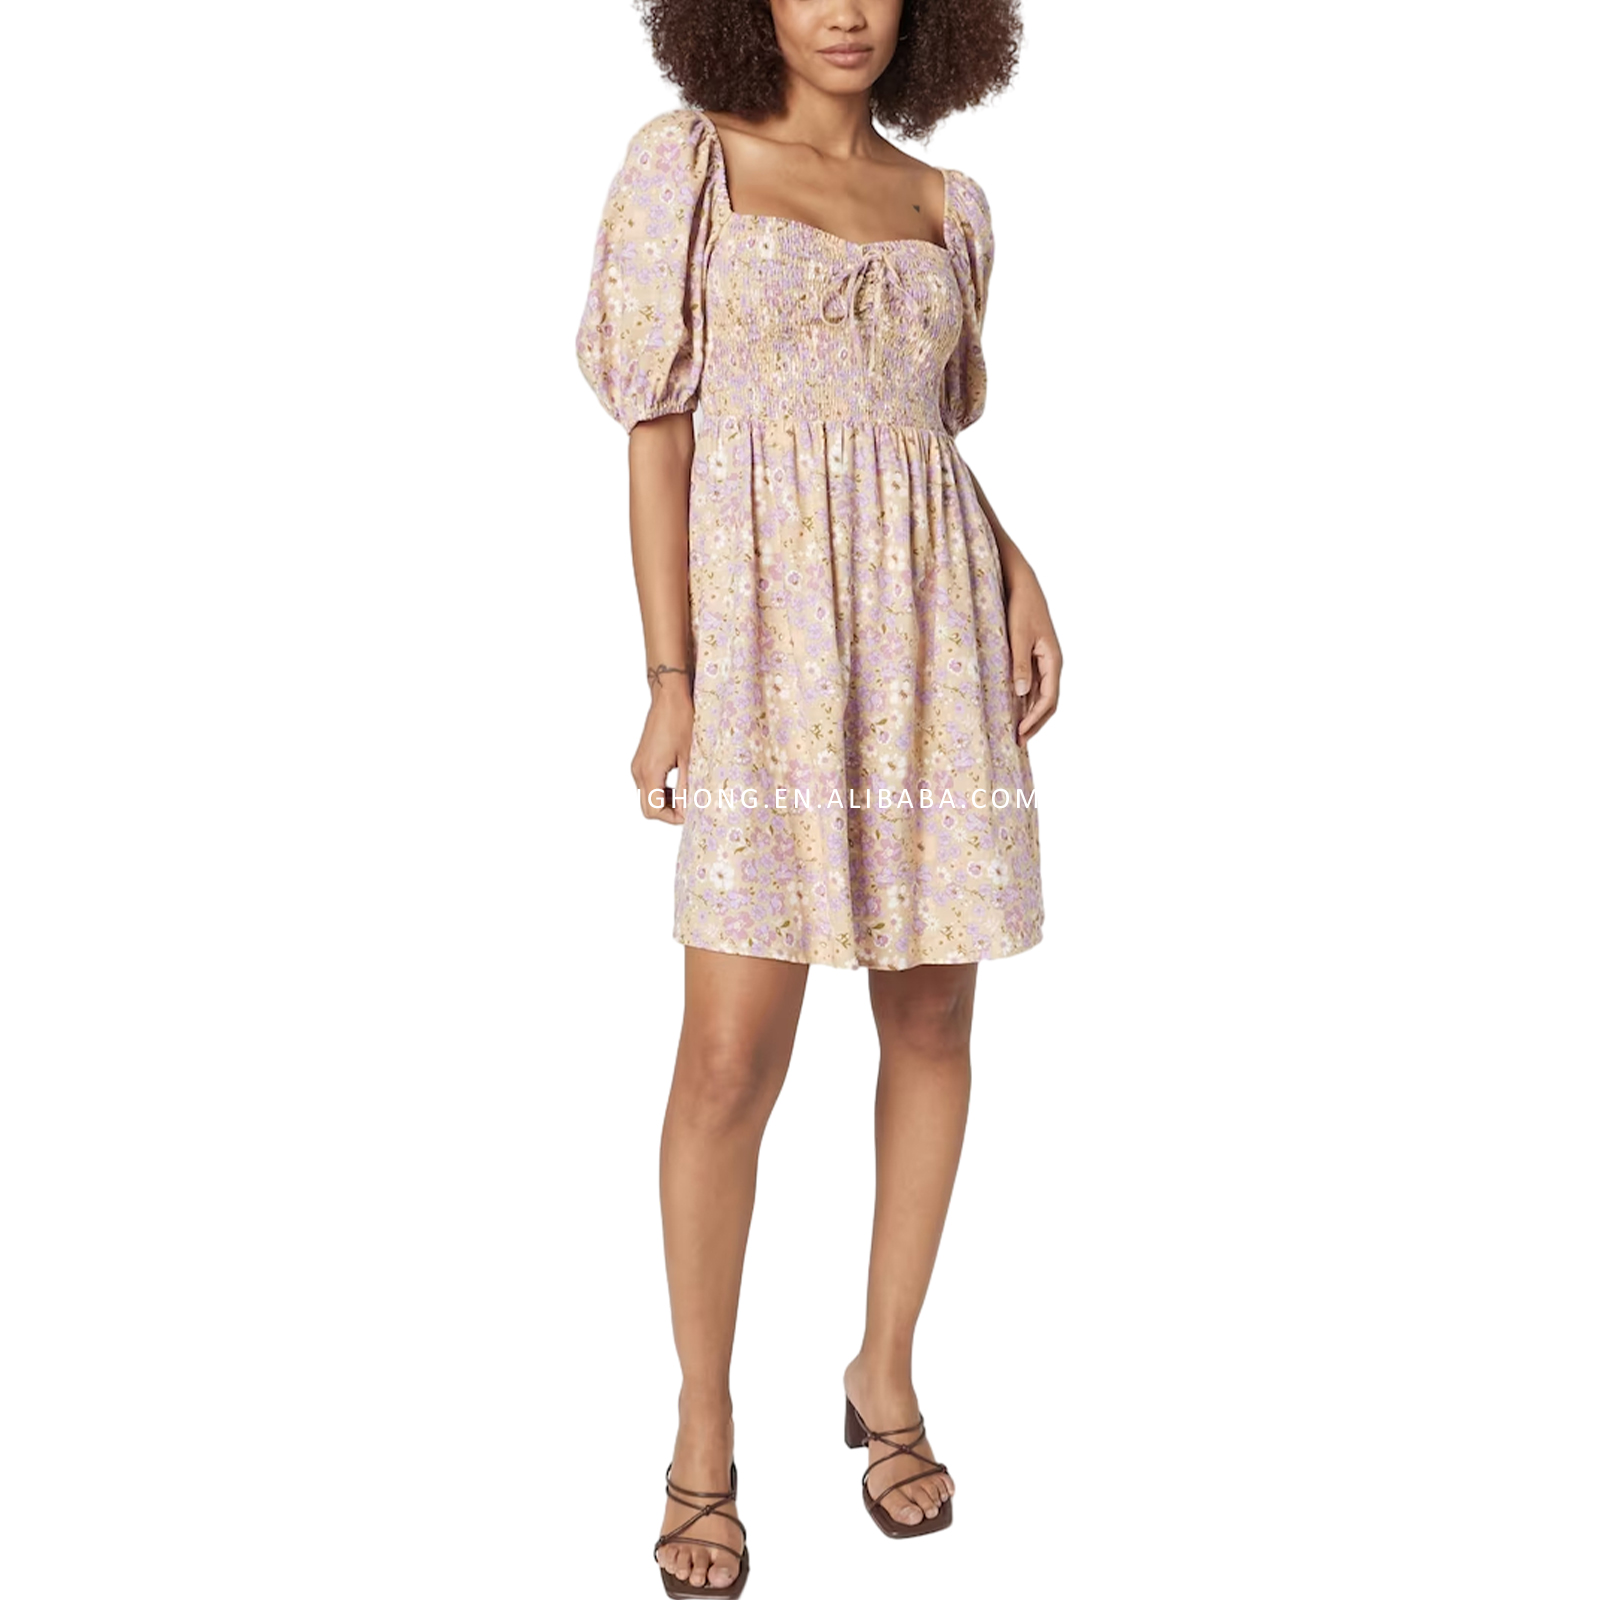
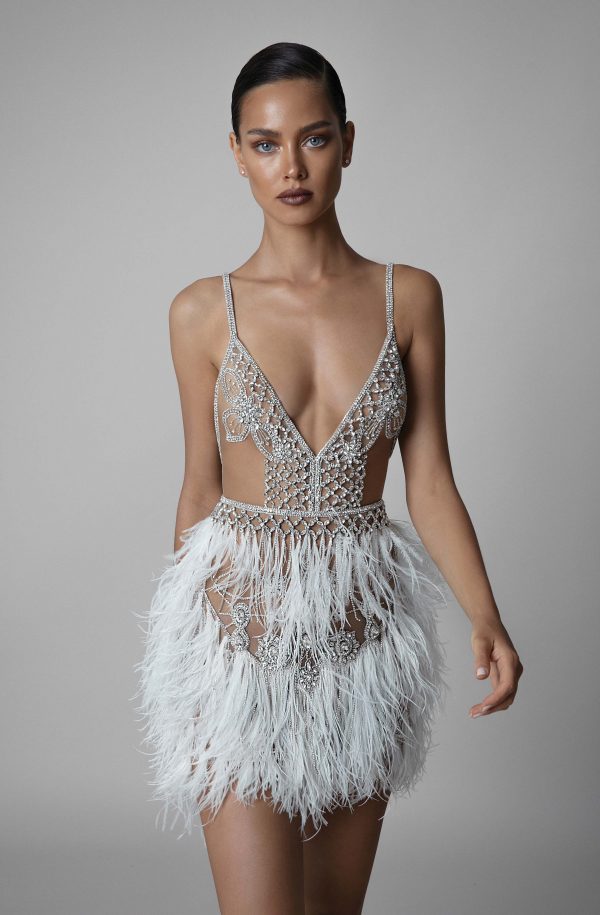
As a dedicated B2B dress supplier, I help brands and retailers source stylish, dependable garments on time. Based in China, I am a Manufacturer with full textile and sewing capabilities, from fabric selection to final QC. My catalog includes dresses for fashion, occasion wear, and workwear, with customization options for size, color, packaging, and branding. I partner with you to simplify orders, negotiate fair MOQs, and provide transparent lead times. You'll enjoy competitive pricing, consistent quality, and a streamlined re-order process. With strict quality control and eco-conscious fabrics, I ensure garments meet international standards. Whether you're seeking private label or white-label solutions, contact me for OEM service, CADs, and sample approvals. I focus on long-term relationships with B2B purchasers who value reliability, speed, and scalable production. Let me help you grow your collection with reliable supply from a China-based Manufacturer.
In 2025, global apparel buyers seek a partner who can manage the full dress lifecycle—from concept and sourcing to production, QC, packaging, and delivery. The true end-to-end solution leverages digital collaboration to share specs, approve samples, track progress in real time, and shorten lead times. By unifying design, sourcing, manufacturing, and logistics, a supplier can adapt quickly to fashion cycles, regulatory changes, and demand spikes while ensuring consistent quality. To win, a B2B dress supplier must offer a seamless design-to-delivery workflow: 3D sampling, transparent BOMs, material traceability, QA at every stage, and scalable production. Streamlined logistics and proactive, data-driven communication help on-time delivery and cost control. A partner that prioritizes ethics, compliance, and clear metrics minimizes risk and accelerates global growth for buyers.
| Supplier_ID | Region | Production_Capacity_Monthly_Units | Lead_Time_Days | MOQ_Units | Product_Categories | Materials_Fabrics | Certifications | OnTime_Delivery_Rate_Pct | Defect_Rate_Pct | Sustainability_Score_1_5 | Avg_Order_Size_Units |
|---|---|---|---|---|---|---|---|---|---|---|---|
| S-1001 | Asia-Pacific | 22000 | 30 | 200 | Dresses, Evening Gowns | Cotton, Polyester, Spandex | OEKO-TEX, ISO 9001 | 92.5 | 1.2 | 4.5 | 800 |
| S-1002 | Europe | 35000 | 25 | 500 | Casual Dresses, Casual Wear | Polyester, Nylon | BSCI, ISO 14001 | 88.3 | 2.8 | 3.8 | 1500 |
| S-1003 | North America | 15000 | 40 | 150 | Formal Dresses, Evening Wear | Rayon, Silk Blend | OEKO-TEX, ISO 9001 | 95.3 | 0.9 | 4.2 | 600 |
| S-1004 | Latin America | 8000 | 60 | 1000 | Uniforms, Workwear, Dresses | Cotton, Polyester | GOTS, BSCI | 76.5 | 3.6 | 3.1 | 350 |
| S-1005 | Africa | 12000 | 22 | 250 | Maxi Dresses, Partywear | Cotton, Cotton-Blend | OEKO-TEX, ISO 9001 | 90.0 | 1.5 | 4.8 | 900 |
| S-1006 | Middle East | 24000 | 28 | 300 | Dresses, Abaya-style | Polyester, Crepe | ISO 9001, SA 8000 | 93.2 | 0.7 | 4.0 | 1200 |